New: TVision State of Streaming
Get the Report
Welcome to the TVison Signal
The twice yearly State of Streaming report provides the industry with benchmarks and insights into advancements and innovation in all things streaming.
New: TVision State of Streaming
The twice yearly State of Streaming report provides the industry with benchmarks and insights into advancements and innovation in all things streaming.
Over the past 12 months we’ve seen some funny, witty and celebrity-filled ads from the insurance industry - an industry that spends more on TV advertising than almost any other.
Here we take a closer look at how well these ads engage their audience, and break down the performance of some of the biggest insurance brands: Allstate, Geico, Liberty Mutual, Progressive and State Farm.
If you're interested in more context and further analysis of the top creative for these brands, be sure to watch our Insurance Industry Spotlight webinar.
| BRAND SCORES |  |
 |
 |
 |
 |
| Linear Viewability | 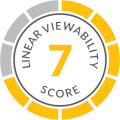 |
 |
 |
 |
 |
| Linear Attention |  |
 |
 |
 |
 |
| CTV Viewability |  |
 |
 |
 |
 |
| CTV Attention |  |
 |
 |
 |
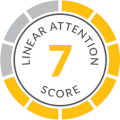 |
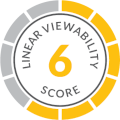
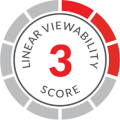
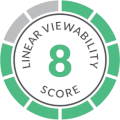
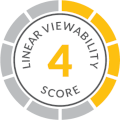
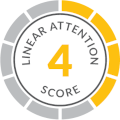
When we look at the table above, we see a few scores stand out. State Farm has significant room for improvement in their Linear TV Viewability - they should optimize toward media opportunities that do a better job of keeping viewers in the room. Geico's CTV scores are especially strong. Others in the industry may want to learn from Geico's CTV strategy.
All results from this report can be found in TVision's Ad Scoreboard. The platform uses a simple scoring system to benchmark ad attention and viewability performance. Advertisers can access their results and uncover competitive performance in this easy-to-use platform.
For example, a score of 7 indicates that the brand is performing better than 70% of all the brands that TVision measures.


| CREATIVE SCORES |  |
 |
 |
 |
 |
| Ad Name |  The Drivewise App: Tight Squeeze |
 The Gecko Eats a Burrito |
 Radar: LiMu Emu & Doug |
 Sign Spinner: Stay |
 Packages |
| Creative Breakthrough Score |  103.9 |
 100.9 |
 101 |
 102.6 |
 102.1 |
| Network Where the Ad Captured Attention the Best |  55.9% |
 45.4% |
 43.3% |
 45.2% |
 47.7% |
| Top Daypart and % Attention | Prime Time 43.1% |
Prime Access 43.5% |
Prime Access 43.9% |
Prime Time 41.5% |
Prime Time 43.1% |
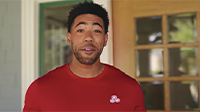
In the chart above we spotlight an additional metric: The Creative Breakthrough Score. TVision's Creative Breakthrough Score compares an ad's performance against other ads that ran in the same pod. Advertisers can use this information, found in TVision's Creative Scoreboard to identify breakthrough ads and optimize media placements to better engage viewers.
The % Attention metrics track what percentage of viewers maintained eyes-on-screen attention for at least 2 seconds. The average % Attention for Linear ads is 37% and 34.5% for CTV ads.
Across the board Primetime and Prime Access dayparts delivered the highest attention for these insurance ads, which is not a surprise as Primetime typically out performs other dayparts. Also notable, NBC delivered the highest attention for both Liberty Mutual and Progressive - indicating the network may also perform well for others in the industry.
TVision’s second-by-second data helps advertisers pinpoint the creative elements - spokespeople, jokes, tones and imagery that best capture viewer attention. In this ad, we see consistently high attention, with spikes at specific voice overs. Watch the full ad and see how viewers paid attention, second by second.
A drop-off in attention that started at week 9 might suggest the ad began to wear-out.
This level of detail is available across every brand and ad in Ad Scoreboard.
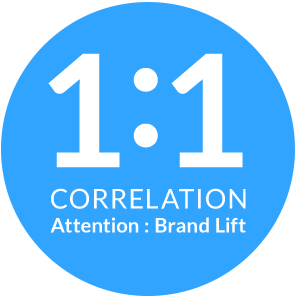
Because a single percentage point increase in attention translates to a corresponding 1% increase in aided awareness and ad recall, optimizing for attention can translate to a significant increase in the number of people who think of the insurer when it's time to buy auto or home insurance.
With TVision's CTV Adoption Score in Ad Scoreboard, advertisers are able to understand their investment in CTV compared to their competitors. These five insurance advertisers are investing in CTV at relatively standard rates compared to all TV advertisers.
| CTV ADOPTION |  |
 |
 |
 |
 |
| CTV Adoption Score | 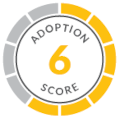 |
 |
 |
 |
 |
Ads that capture attention on linear, don't always perform the same way on CTV, and so advertisers making significant CTV investments need to understand where their campaigns perform best on CTV. In the case of these insurance advertisers, MVPD apps like AT&T Now and Xfinity, which deliver a linear-like viewing experience are also delivering the most ad attention.
| CTV APP ATTENTION |  |
 |
 |
 |
 |
| CTV App Where the Brand Captured Attention Best |  48.3% |
 49.4% |
 44.7% |
 54.1% |
 48.3% |
Linear television delivers 37% ad attention on average, but across networks and dayparts there are significant variances in attention. Savvy insurance advertisers use TVision's Ad Scoreboard to pinpoint the networks and dayparts where they - and their competitors -perform best, and re-assign inventory and creative accordingly.
In the table below, we highlight the top performing Linear TV Networks and Dayparts for these insurance brands.
ATTENTION VARIS BY NETWORK, DAYPART AND PROGRAM

 |
 |
 |
 |
 |
|
| Linear TV Network Where the Brand Captured Attention Best |  42.5% |
 40.1% |
 41.0% |
 43.0% |
 40.6% |
| Linear TV Daypart Wherre the Brand Captured Attention Best | Prime Access 41.1% |
Prime Time 41.0% |
Prime Access 40.1% |
Prime Time 40.7% |
Prime Time 38.7% |
In the battle for brand awareness, insurance advertisers are trying to reach key demos at the right time, to ensure their brands are top of mind when it comes time to purchase or renew insurance. But some brands are capturing attention from key demos better than others, and some are doing better on CTV than average advertisers, with specific demos.
Within Ad Scoreboard, advertisers can see how well they perform with specific age and gender demographics. Here we highlight the age demos where insurance advertisers out-performed the average by the highest amount. Allstate was able to capture attention better than average from the hard-to-engage 18-29 year old demo across both CTV and Linear, while Liberty Mutual had a harder time breaking through across all demos.
| OUT PERFORMING DEMOS |  |
 |
 |
 |
 |
| Best Performing Linear Demo and Ad Attention Difference From the Norm | 18 - 29 +2.80% +2.80% |
50 -59 +3.20% +3.20% |
40 - 49 +0.30% +0.30% |
50 - 59 +3.00% +3.00% |
50 - 59 +1.90% +1.90% |
| Best Performing CTV Demo and Ad Attention Difference From the Norm | 18 - 29 2.00% 2.00% |
18 - 29 +4.10% +4.10% |
60+ -1.70% * -1.70% * |
30 - 39 +6.30% +6.30% |
60+ +4.00% +4.00% |
* Liberty Mutual did not outperform for ad attention across any demos on CTV.
TVision’s Ad Scoreboard provides mid-campaign performance stats so your teams can easily integrate Attention insights into their planning, creative, and measurement processes.
Compare Ad Scoreboard and TVision's Enterprise Platform here.

See how your brand is performing on Linear and CTV to make apples-to-apples comparisons

See how your brand, creative, and network partners perform against industry averages

Make comparisons with any competitor to uncover what ads and networks drive success

Identify the networks where your target audiences are most engaged

Measure results over time and gain early indicators of performance across Linear and CTV

Understand which parts of your creative get the most attention, down to the second
TVision maintains an opt-in panel of 5,000 TV and CTV viewing households and is able to report second by second attention and viewability for 13,000+ viewers. Data in this report was compiled between August 15, 2021 and August 15, 2022.
