Americans now spend 55% more time on ad-supported apps than they did just two years ago. As we discussed in our recent blog about the future of ad-supported TV, this shift is creating many new opportunities for media buyers and sellers alike—and nearly as many questions. Chief among these is how to properly value CTV impressions.
Today’s CTV inventory often uses a standard multiple to represent the average number of people watching in the room together—regardless of the app or what content viewers are watching. To engage this increasingly connected audience, media buyers and sellers alike need to definitively know how many people are in the room, who they are, and who among them is paying attention. After all, households don’t watch TV—people do.
With person-level data for TV viewing behavior, TVision is the only company that can provide accurate co-viewing rates for CTV. In this post, we’ll shed some light on just how much co-viewing can vary with insights from our recent State of CTV Advertising Report.
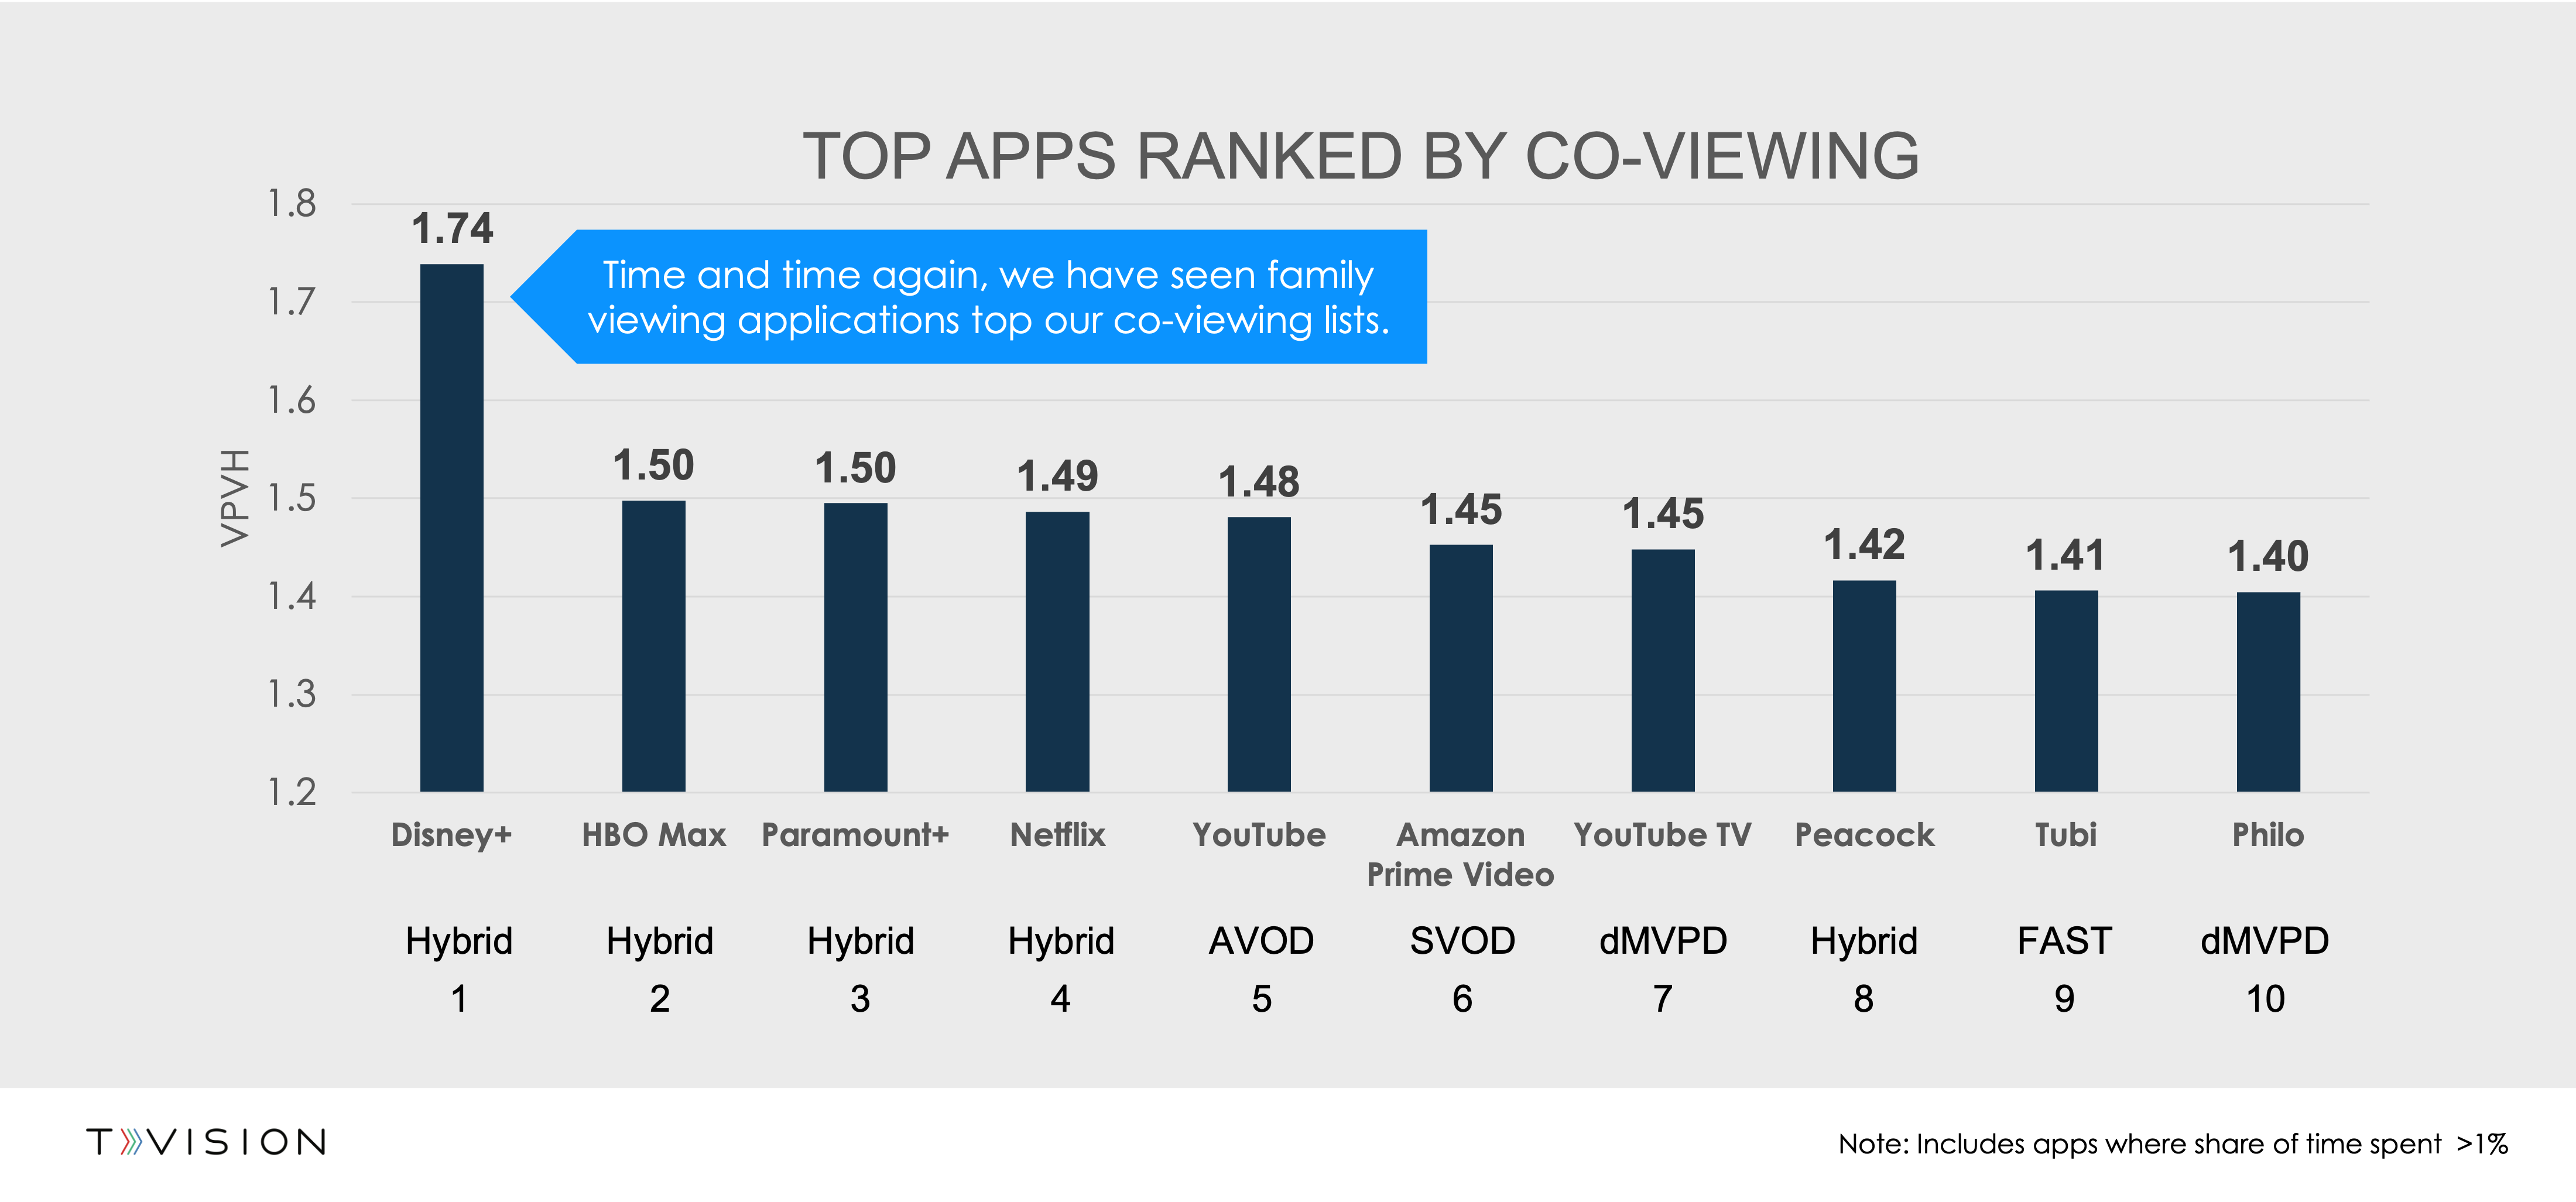
Co-Viewing rates provide insight into the real reach of CTV applications and programming. They serve as a multiple that can help both marketers and platforms better value CTV ad inventory. Apps with high Viewers Per Viewing Household (VPVH) offer greater reach per impression as well as more engaged viewers. Our studies have also shown that when viewers watch TV with at least one other person, they pay more attention. In the chart below, we highlight the top applications based on how many people, on average, are in the room watching together.

Time and time again, we have seen family viewing applications top our co-viewing lists. This year was no exception as Disney+ well surpassed other apps for VPVH. Looking at the other apps that topped the list, Hybrid subscription/ad-supported apps like HBO Max, Paramount+, and Netflix all made a strong showing. HBO Max boasts strong movie content and blockbuster hits to draw in multiple viewers. Paramount+ offers family-friendly programming (for example, Nickelodeon content) and sports. And finally, Netflix has a massive library of content to attract co-viewers of any genre. All told, these apps’ ability to bring in co-viewers suggests that content is a strong driver of co-viewing scenarios. Meanwhile, apps that mimic linear environments such as dMVPDs fell lower on the list.
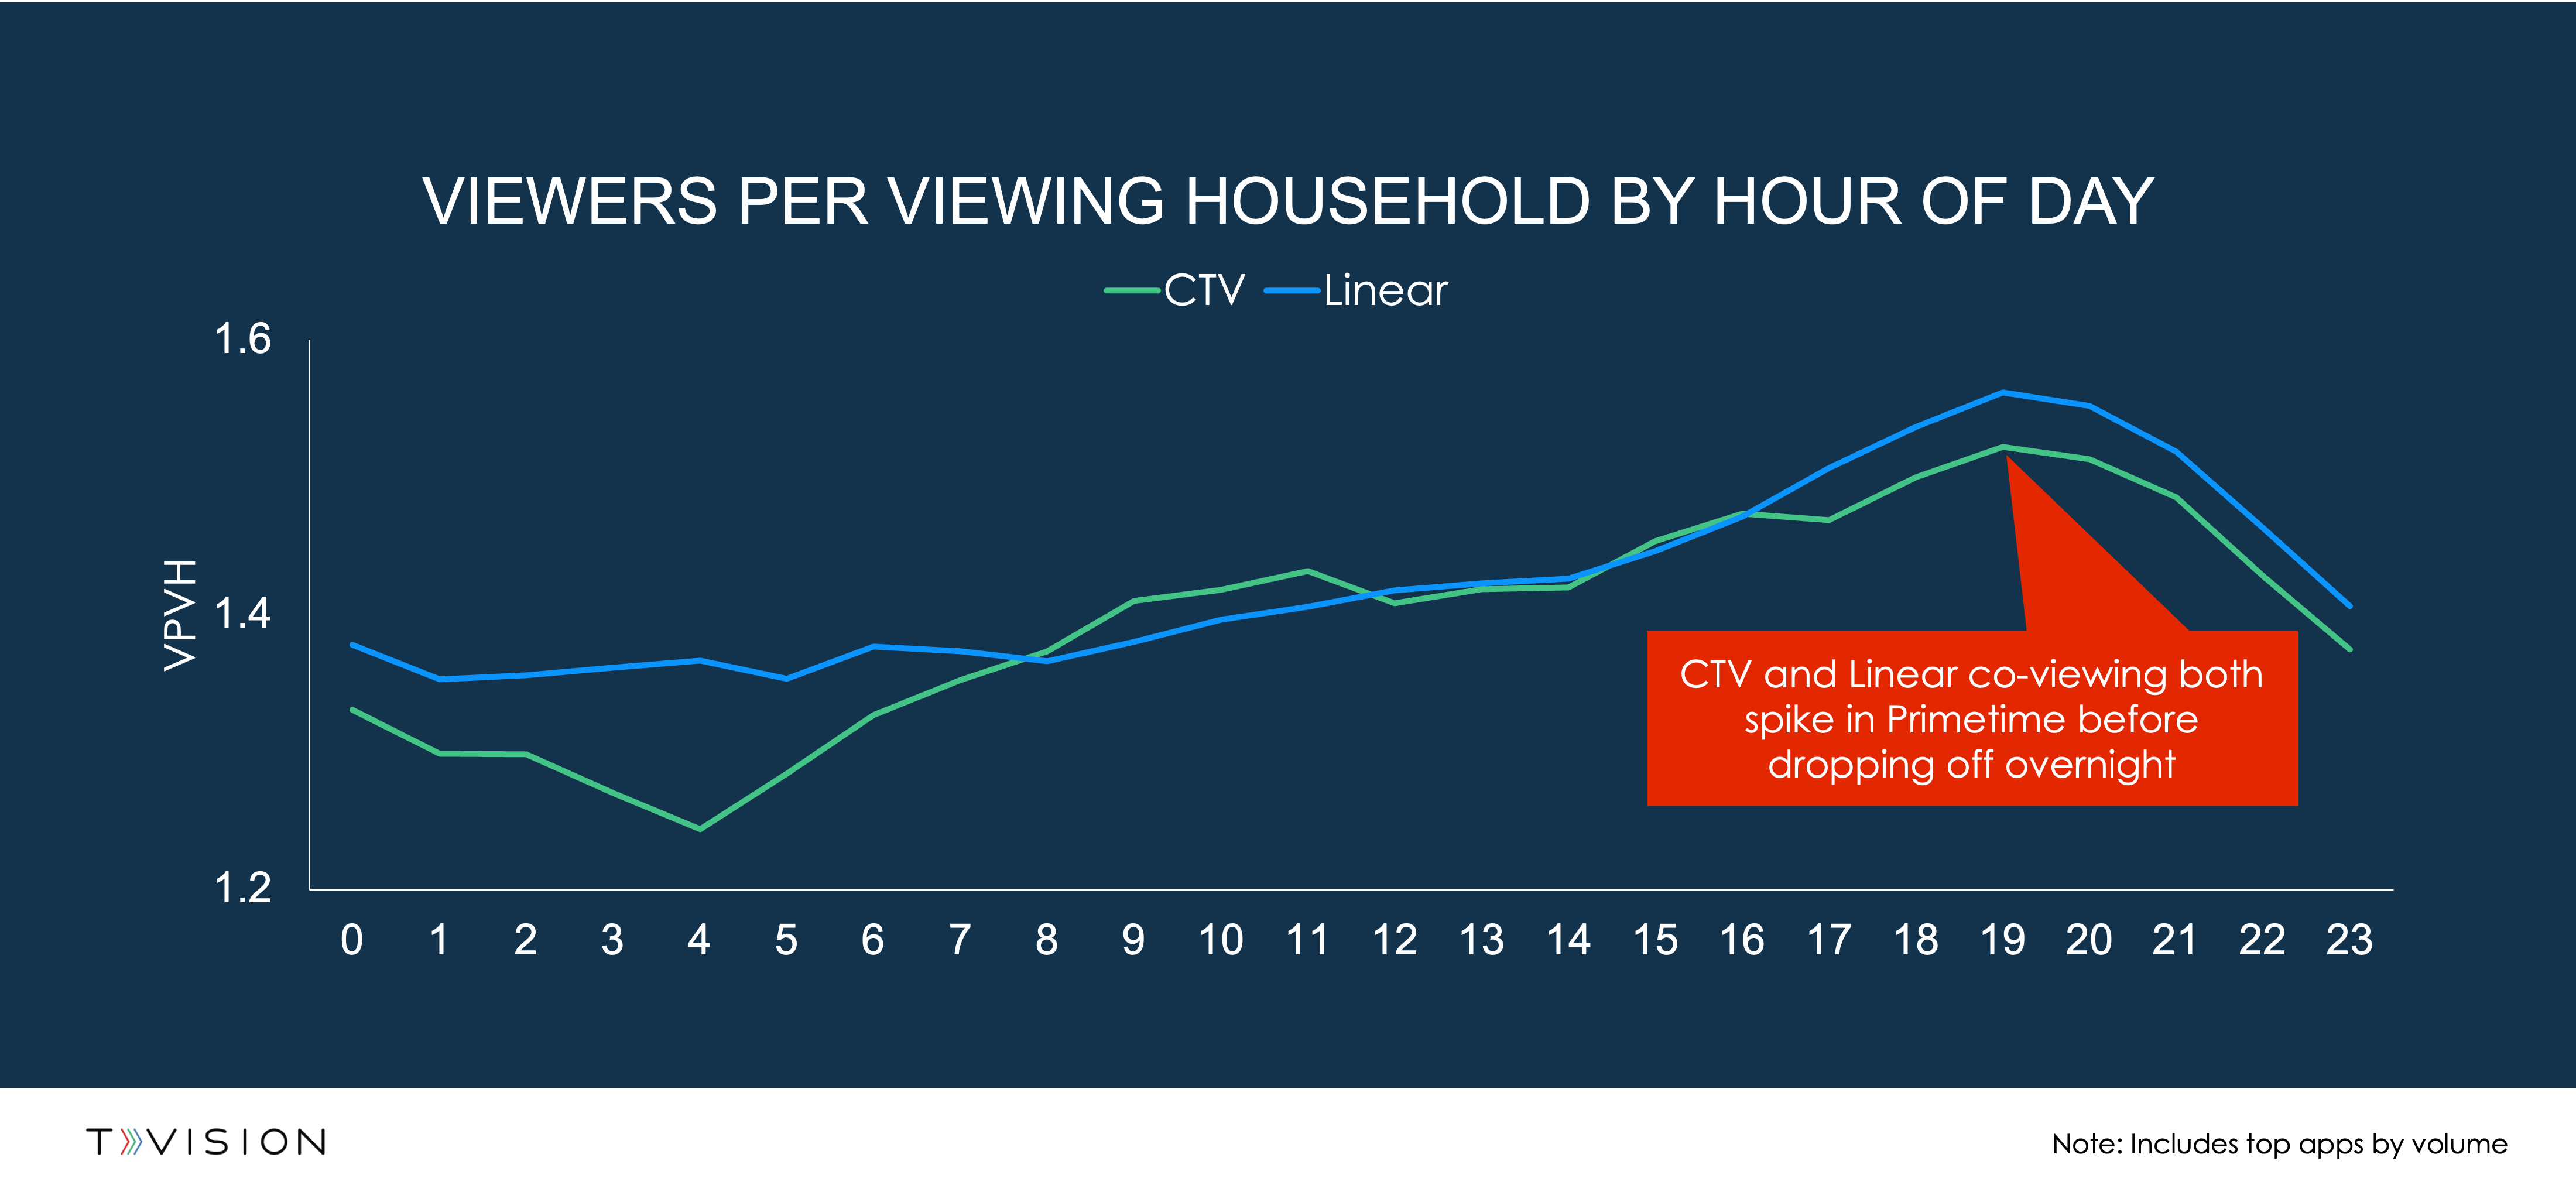
When considering co-viewing, it’s important to look at where audiences are likely to watch content together, when, and how this compares to linear. Overall, viewers are almost as likely to watch CTV content with friends and family as they are to watch linear TV together. Linear TV typically sees Viewers Per Viewing Household (VPVH) averages of 1.46, while CTV falls only slightly lower at 1.44. This holds true when looking at co-viewing throughout an average day. In fact, when we look at co-viewing trends by hour, CTV follows similar patterns to linear—notably spiking in primetime when VPVH reaches a high of 1.52.

However, there are two places where co-viewing starts to diverge—specifically around the 9-10 mark on the chart (9am - 10am) and 15-16 (3pm - 4pm). During these times, the green line for CTV surpasses the blue line for Linear. In general, CTV viewers tend to skew younger than Linear (more on this later), and these specific times correspond to when children are often either home or returning from school.
By understanding who is in the room, how many people, and when, advertisers can start to better position their targeting in environments or apps where they know there will be higher co-viewing rates. Likewise, media sellers can gain a more accurate metric to properly value impressions.
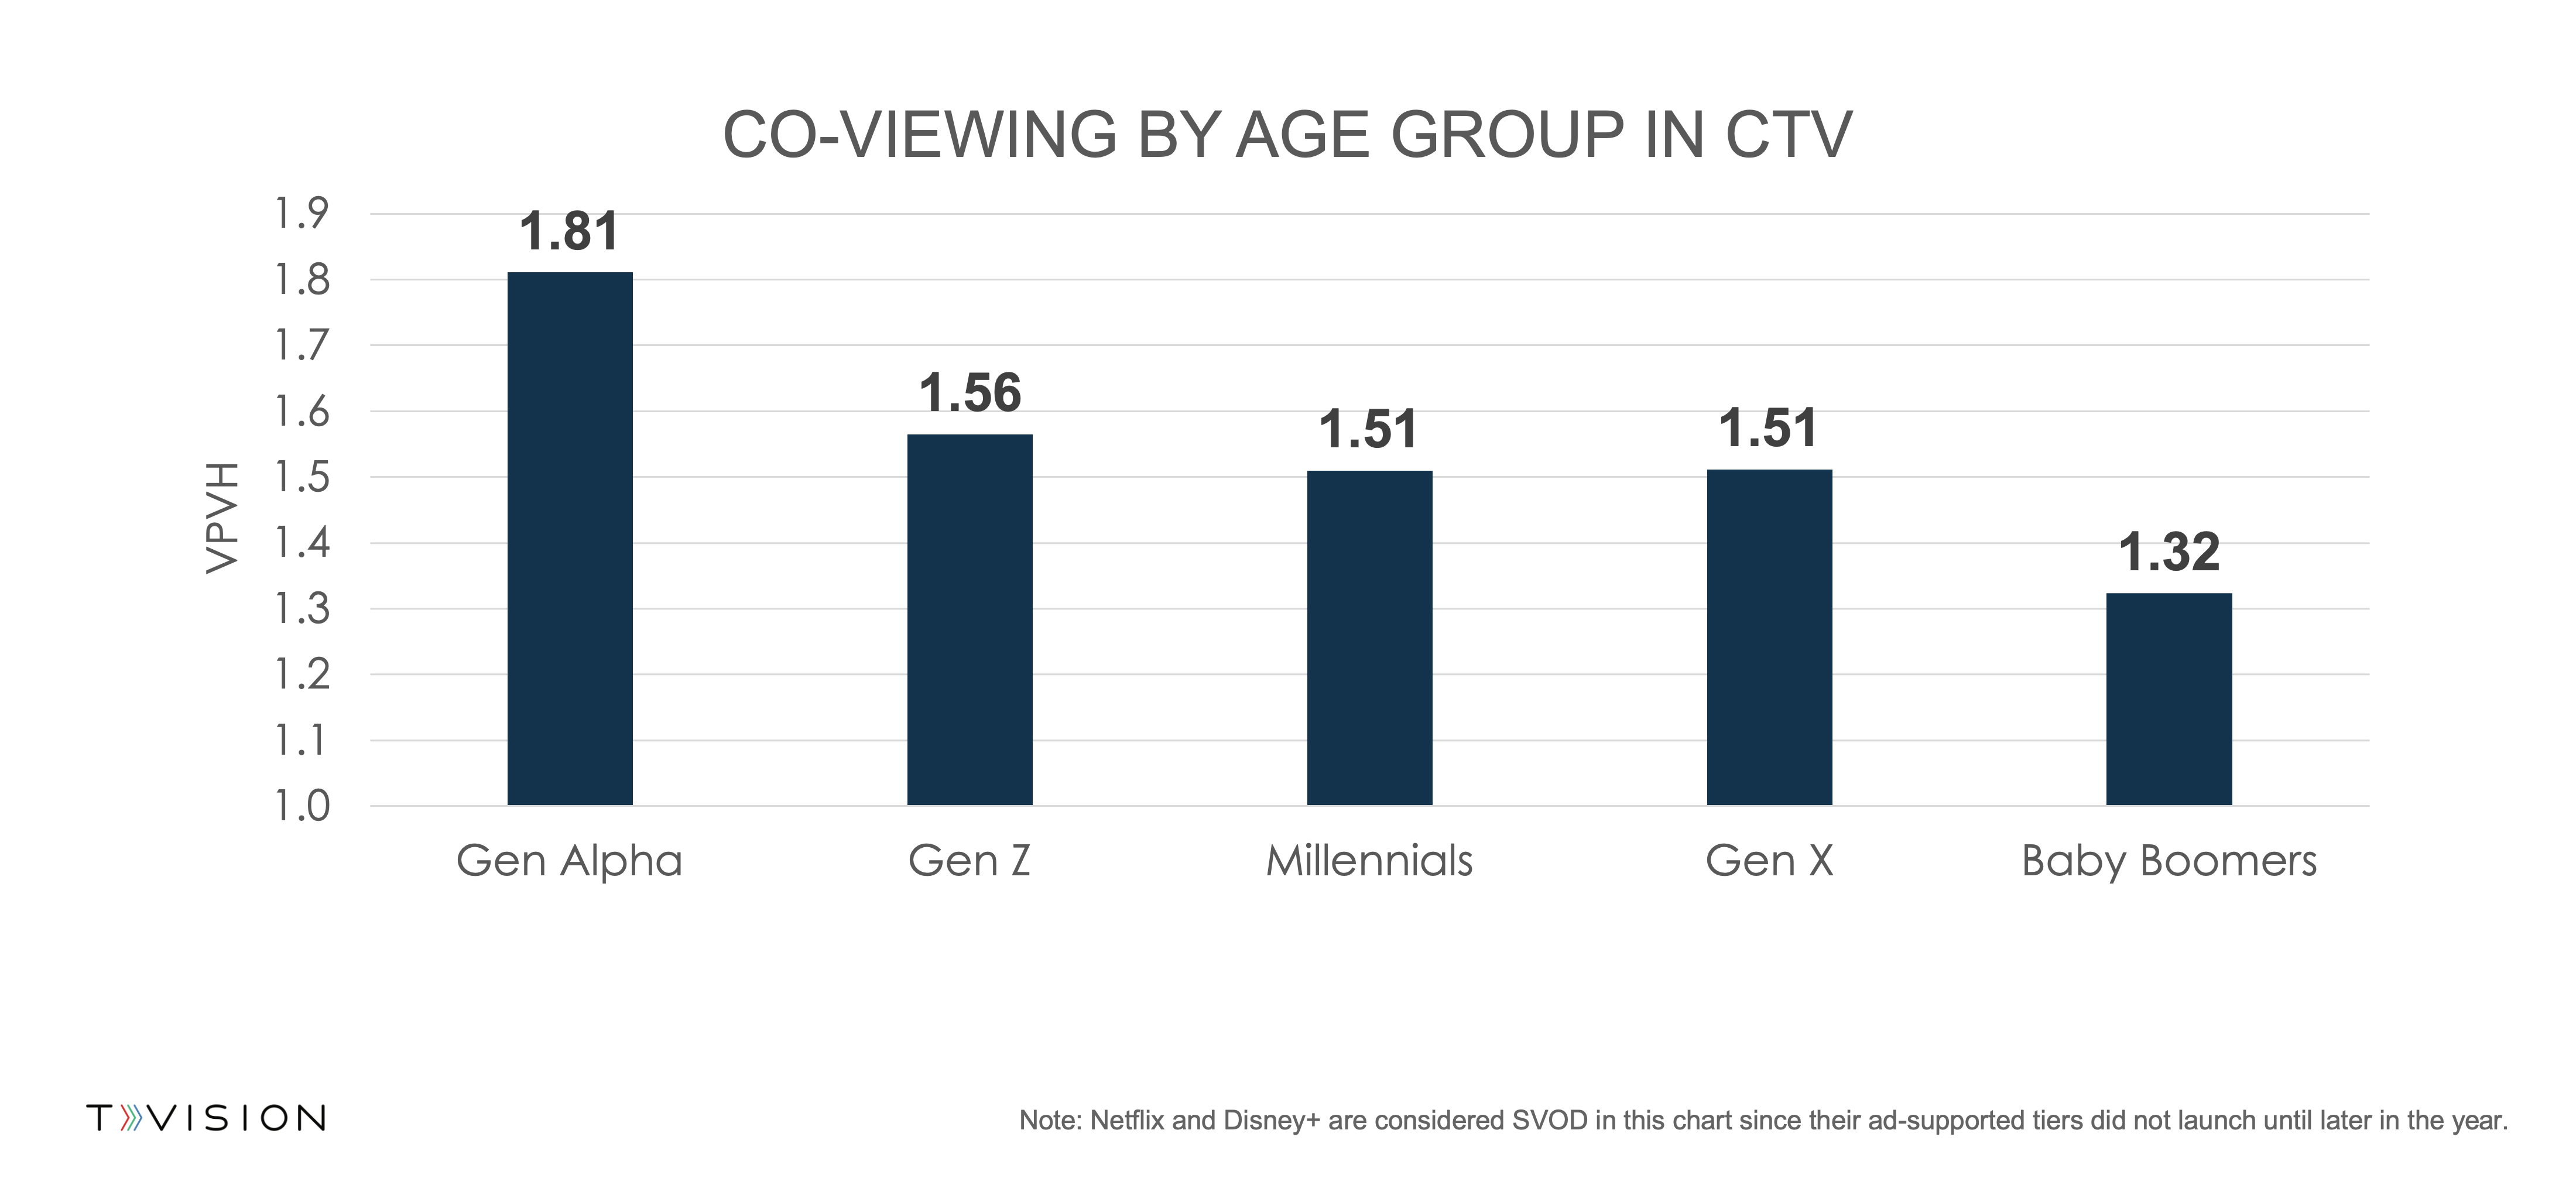
As mentioned in the section above, younger audiences are more likely to watch CTV content with more people. Specifically, households with Gen Alpha and Gen Z members average higher co-viewing rates than households made up of Gen X, Baby Boomers, or even Millennials.

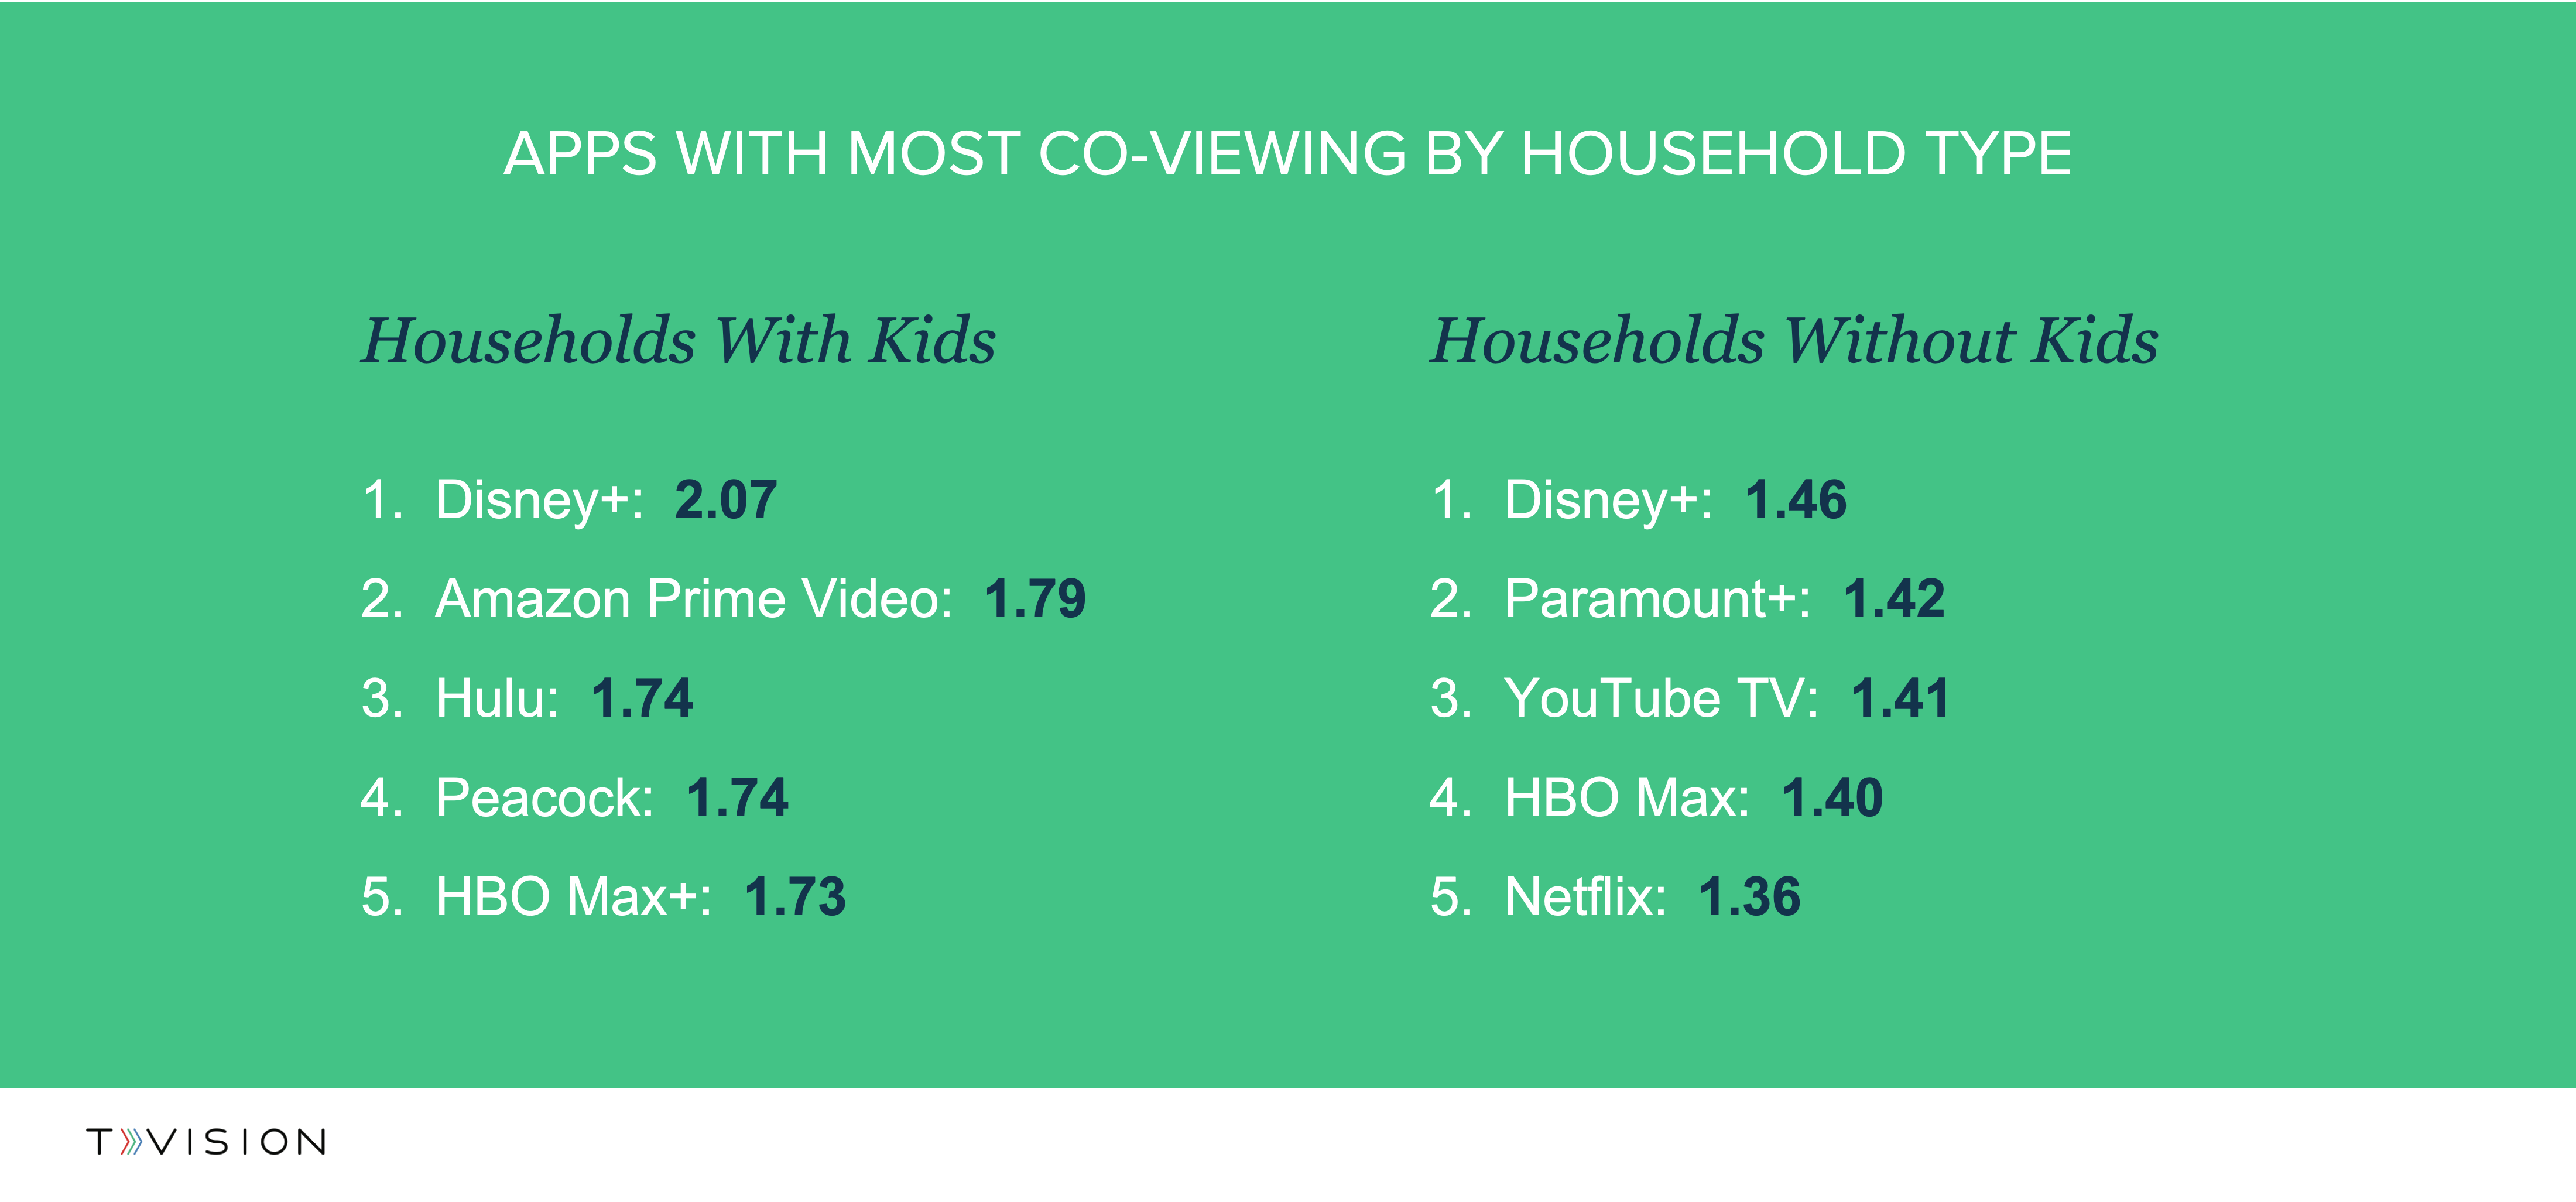
Co-viewing may depend on who is watching and with whom. We broke out our co-viewing by demographics data into two additional segments: households with children under 18 and those without. It turns out that CTV is often a family affair. Co-viewing rates for households with children are significantly higher than they are for households without. In fact, households with children have 42% more viewers in the room when watching Disney+ compared to adult-only households.

Outside of Disney+, the top 5 lists for each of these groups are quite different. The top apps for households with kids all contain child-friendly content. However, the apps for households without kids include dMPVDs like YouTube TV and other apps with a variety of content like sports and movies. This suggests that just because a household doesn’t have kids doesn’t mean they’re unlikely to watch TV together. Rather, they co-view different content and potentially with fewer people present in the room.
These insights are just scratching the surface of what we explored in our new State of TV Report. Want to learn more about how many people are co-viewing CTV, where to find the most valuable impressions, and how programming impacts engagement? Download the full report today, check out our webinar, and stay tuned for the next installment in our blog series on CTV Co-Viewing.
At TVision, we see that overall CTV co-viewing rates are much higher than the average that the industry typically assumes. This means media buyers and sellers may be undervaluing inventory that offers greater reach per impression.
TVision has recently introduced Total View, the industry’s most comprehensive look at person-level viewer engagement across both CTV and linear. With a unified view of the entire TV landscape, media sellers can identify premium impressions based on viewer engagement and show the true value of their media properties. Want to learn how you can gain key engagement metrics like co-viewing for ad performance and viewer trends across hundreds of apps, networks, and thousands of shows? Contact us today to get started or request a demo.